PUBLISHED: August 2025 by Nick Stiltner, Conservation Technician
The conservation technician role at Houston Parks Board has many different responsibilities. One of the aspects of the role is monitoring and developing a method that works for my specific habitat specialization, forestry. The goal is to establish monitoring areas within my sites that can be revisited yearly to gather important data such as biodiversity, presence of invasive species, tree health, and wildlife indicators. Let’s take a look at the methodology of the monitoring process we are beginning this year below.
Our team has developed a methodology based on the system used by the Houston Arboretum. We have adjusted their method to fit our sites, but the outline of their process remains mostly the same. We did not want to reinvent the wheel, so we decided to use an already existing and successful model. This could prove to be beneficial down the line if we ever need to exchange or reference data outside of our organization.
METHODOLOGY
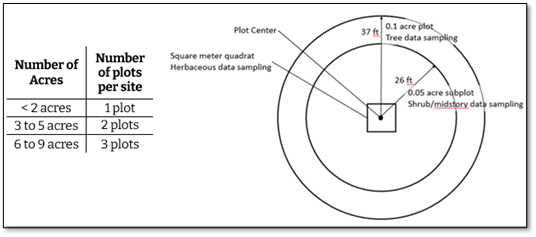
The methodology of the forestry assessment can be demonstrated by the illustration above, Figure 1. The process is divided into four steps: plot setup, inner quadrat, inner circle, and outer circle.
To begin, we select a random GPS point within the site, using online maps. The table on the left side of Figure 1 determines how many GPS coordinates we select. It is important to select these points as randomly as possible to get a realistic representation of the site. Once the team solidifies the GPS points, we travel to the site and set up a marker to designate the center of the plot. This will be recorded for future monitoring trips to repeat the process and gather continuous data.
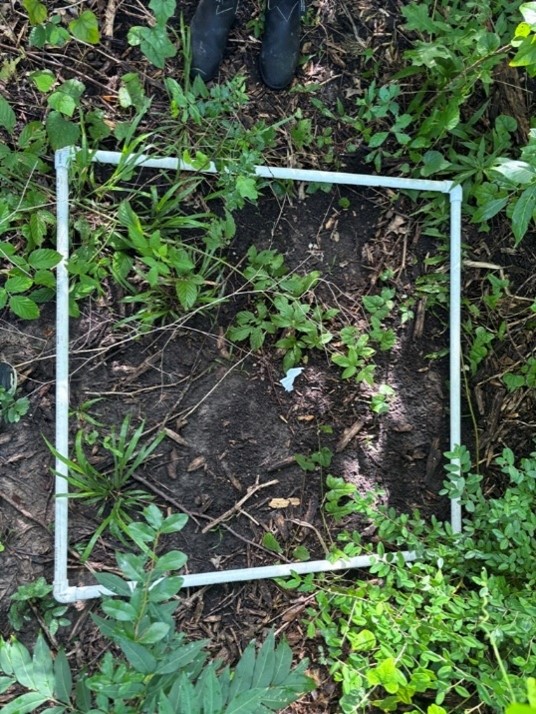
Then, we set up the plot, using equipment such as rolling measuring tapes, a PVC one-square-meter (1mx1m) quadrat, and flagging. The 1mx1m square quadrat is placed around the center point of the site. Next, we measure in four different directions from the center of the plot, using the rolling measuring tape. Each time we measure, the team sets markers at 37 feet (ft) and 26ft along the tape. This will create a 0.1-acre plot that serves as the basis for our data collection. Plot setup complete.
Once the plot is established, we can take an in-depth look at the area. Inside the quadrat, we list the species that are present and count the number of stems each species has. We also estimate the percentage cover of the quadrat. Essentially, this projects how much of the soil is covered by vegetation within this small square. Inner quadrat complete
Next, we gather data in the largest section, the inner circle. This extends from the quadrat edge to our 26ft markers. We record all understory species observed, taking special note of any invasives found. Then, we record the species’ names and the diameter at breast height (DBH) of any midsized (>6 in DBH), overstory tree in the area. Inner circle complete.
Following, we move to the outer circle, from 26ft to 37ft. In this area, the team records the species names and DBH of any mid-sized, overstory tree in the area. Outer circle complete.
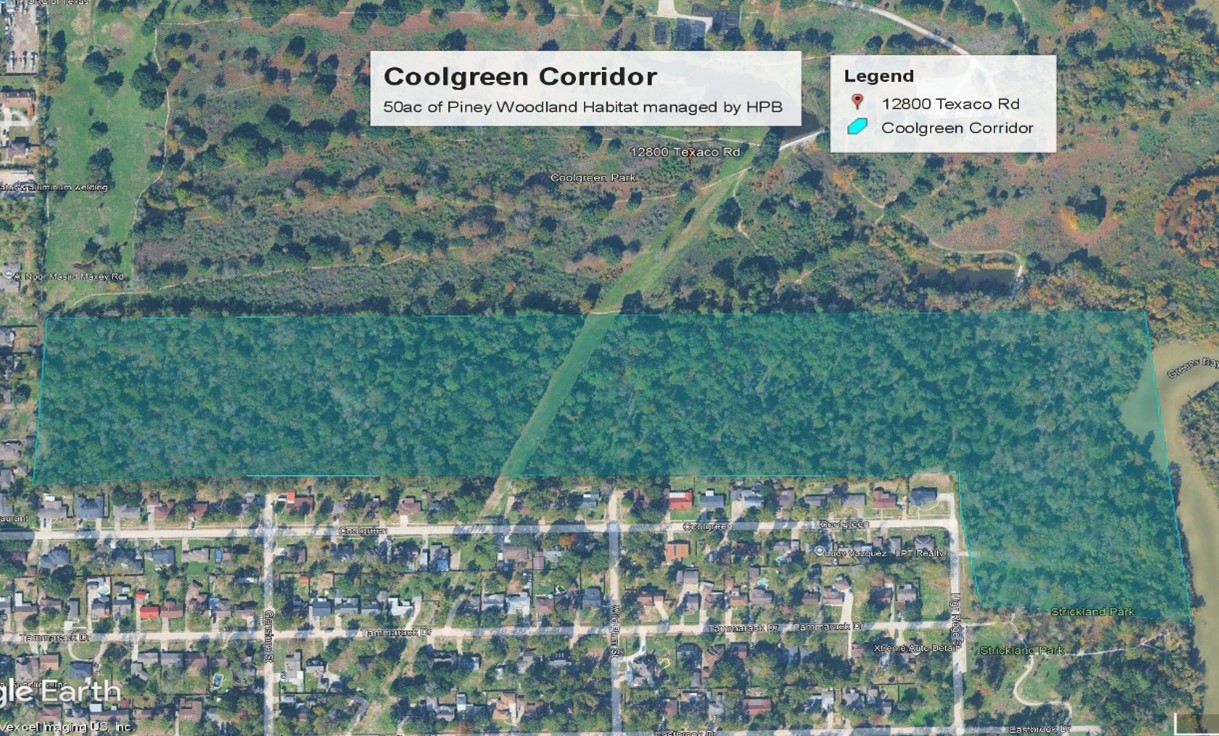
COOLGREEN CORRIDOR
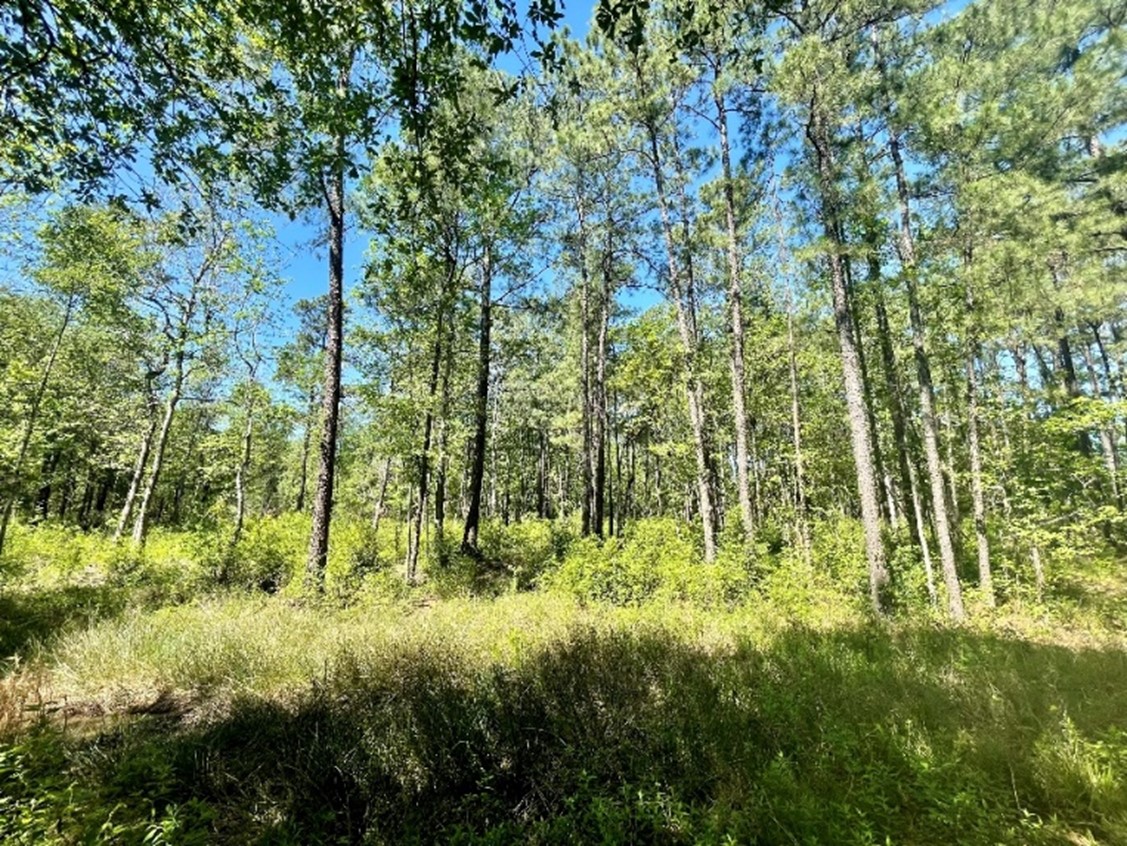
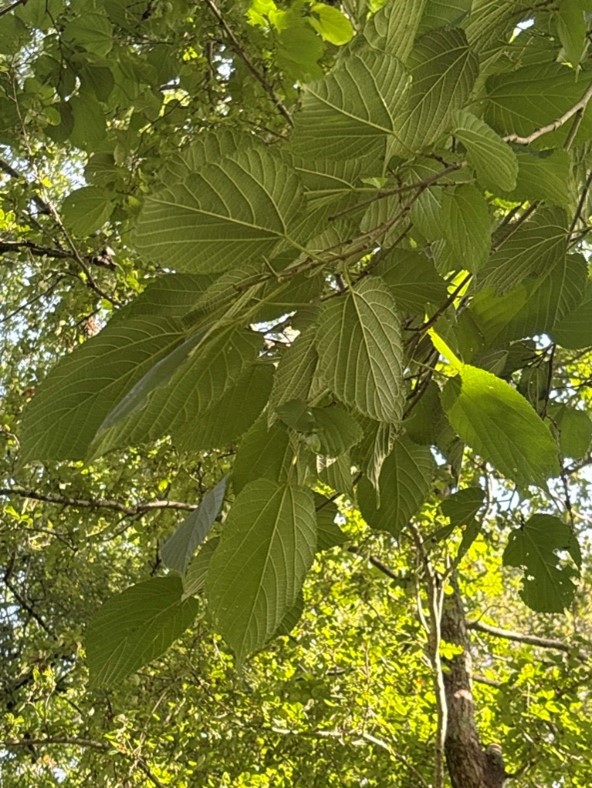
We began our monitoring this year at our site along Greens Bayou, called the Coolgreen Corridor. It is a large (more than 45 acres), lightly managed piney woodland habitat. This area is our largest woodland site and provides the perfect testing ground for this new assessment.
Overall, the goal of developing this process is to gather baseline data at each of our woodland sites. Using this data, we can analyze our sites, inform our management plans, and measure the effectiveness of our work. By gathering data yearly, we can use the information as a reference for all of HPB’s woodland work going forward.
Coolgreen Corridor Map
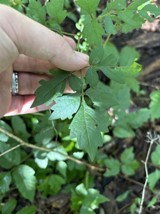
Red Mulberry (Morus rubra)